When You Have Your Own Iconic Brand…

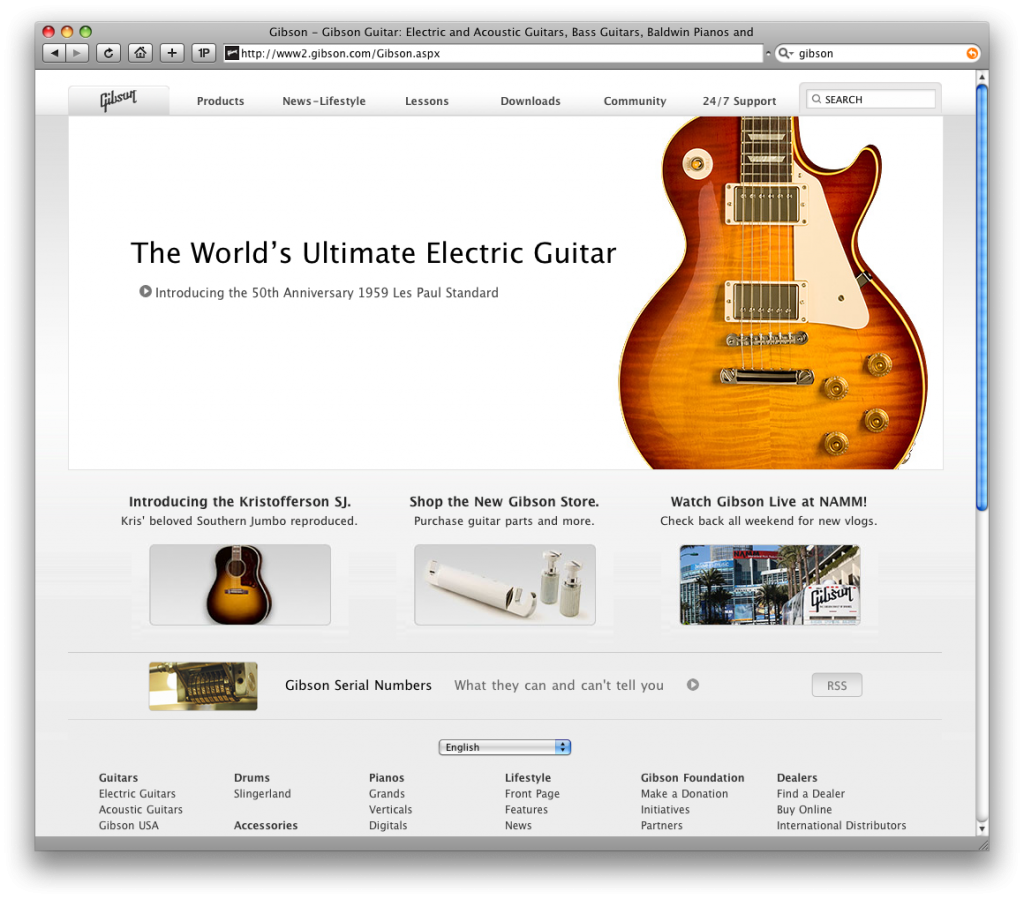
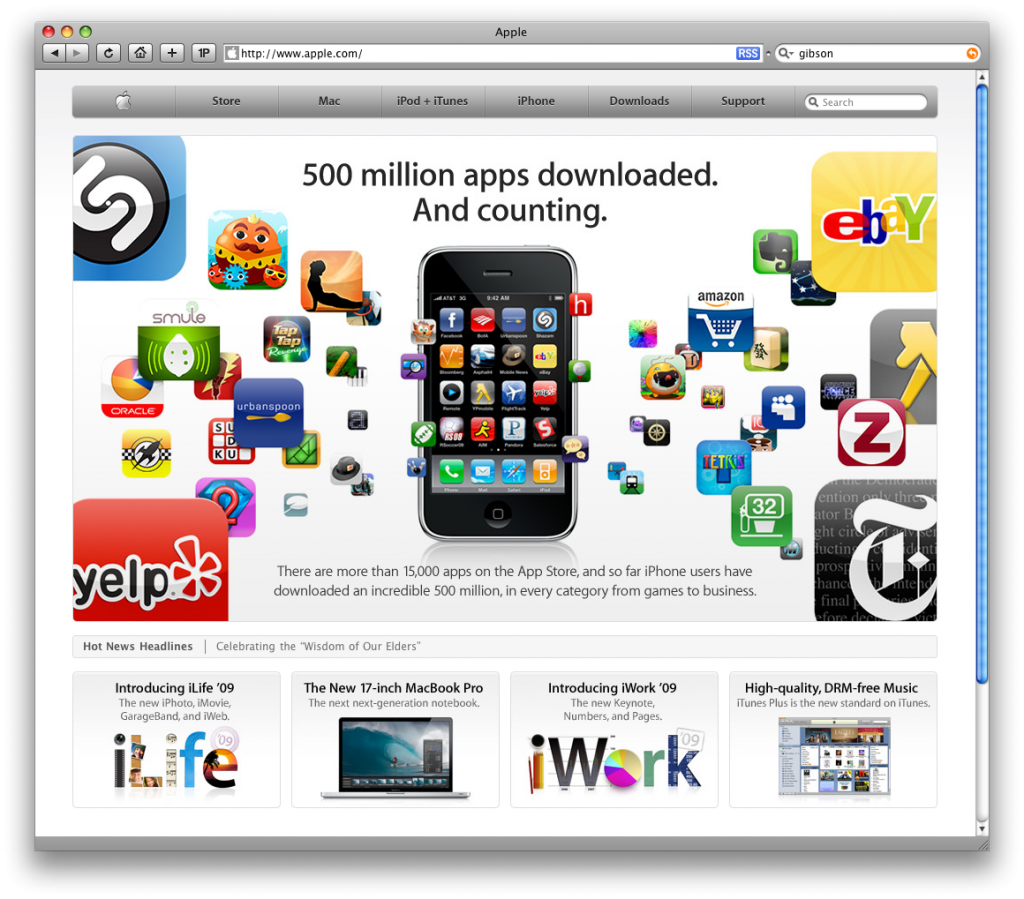
Did Gibson think that nobody would notice when they completely-ripped off Apple for  their new website design?

Gibson's New Site

For reference, here is a screencap of Apple’s site:

Apple's Current Site

Which brings me to two points:

  1. When you have your own iconic brand, you really shouldn’t need to steal so shamelessly.
  2. It’s 2009, Gibson. Did you really think table-based layout was still a good idea?

Where To Purchase Your Next Mac

I’ve been to a few Apple stores in the past and I love their clean design. The products they sell are well displayed and their staff are usually very helpful, but I am always looking for a bargain. So I can’t envision myself purchasing a new computer from my local Apple store with the deals that Amazon is currently offering (mail in rebates on all Macs from $25-$150). Below is a chart comparing the Apple store price vs. the Amazon prices for all Mac computers. Shipping is free from both Apple and Amazon, unless of course, you need your Mac shipped express.

With the money that you save by purchasing from Amazon you can increase your RAM, purchase peripherals, or hold onto that money for a rainy day. The choice is rather easy if you look at the prices below. I have added a 5% sales tax to all Apple prices. Your particular sales tax may be higher or lower depending on where you live.

Model Apple Store Price* Amazon Price**
Apple MacBook 13.3″ Laptop (2.4 GHz Intel Core 2 Duo Processor, 2
GB RAM, 160 GB Hard Drive)
$1,363.00 $1,204.99
Apple MacBook 13.3″ Laptop (2.4 GHz Intel Core 2 Duo Processor, 2
GB RAM, 250GB Hard Drive) – Black
$1573.95 $1,398.97
Apple MacBook Pro 15.4″ Laptop (2.4 GHz Intel Core 2 Duo Processor,
2 GB RAM, 200 GB Hard Drive, DVD/CD SuperDrive)
$2098.95 $1,789.99
Apple MacBook Pro 15.4″ Laptop (2.5 GHz Intel Core 2 Duo Processor,
2 GB RAM, 250 GB Hard Drive, DVD/CD SuperDrive)
$2,623.95 $2,289.99
Apple MacBook Pro 17″ Laptop (2.5 GHz Intel Core 2 Duo Processor,
2 GB RAM, 250 GB Hard Drive, DVD/CD SuperDrive)
$2,938.95 $2,557.98
Apple MacBook Air 13.3″ Laptop (1.6 GHz Intel Core 2 Duo Processor,
2 GB RAM, 80 GB Hard Drive)
$1,888.95 $1,689.99
Apple MacBook Air 13.3″ Laptop (1.8 GHz Intel Core 2 Duo Processor,
2 GB RAM, 80 GB Hard Drive)
$2,727.90 $2,743.00
Apple Mac mini (1.83 GHz Intel Core 2 Duo, 1 GB RAM, 80 GB Hard Drive,
Combo Drive)
$628.95 $570.00
Apple Mac mini (2.0 GHz Intel Core 2 Duo, 1 GB RAM, 120 GB Hard Drive,
SuperDrive)
$838.95 $769.99
Apple iMac Desktop with 20″ Display (2.4 GHz Intel Core 2 Duo, 1
GB RAM, 250 GB Hard Drive, DVD/CD SuperDrive)
$1,258.95 $1,144.00
Apple iMac Desktop with 20″ Display (2.66 GHz Intel Core 2 Duo, 2
GB RAM, 320 GB Hard Drive, DVD/CD SuperDrive)
$1,573.95 $1,419.00
Apple iMac Desktop with 24″ Display (2.8 GHz Intel Core 2 Duo, 2
GB RAM, 320 GB Hard Drive, DVD/CD SuperDrive)
$1,888.95 $1,694.00
Apple Mac Pro Desktop (Two 2.8GHz Quad-Core Intel Xeon Processors,
2 GB RAM, 320 GB Hard Drive, 16x SuperDrive)
$2,938.95 $2,589.99
* Apple price includes local/state sales tax of 5% (Sales tax may be higher or lower depending on your location). Amazon price includes mail-in rebate (expirese 7/14/08)
Residents of KS, KY, ND, NY and WA have to pay a sales tax on all Amazon
purchases. (Thank your state legislatures.)

Does Numbers Make Charts Like This?

I’m in the process of upgrading my first-generation Core Duo Macbook, which is getting a little long-in-the-tooth. So this afternoon I visited Apple.com and I took a little time to review the specs of the newly released models.

I eventually came across the following bar chart, which is accessible as a pop-up from this page. It compares my current notebook (coincidentally) with the one I intend to purchase.
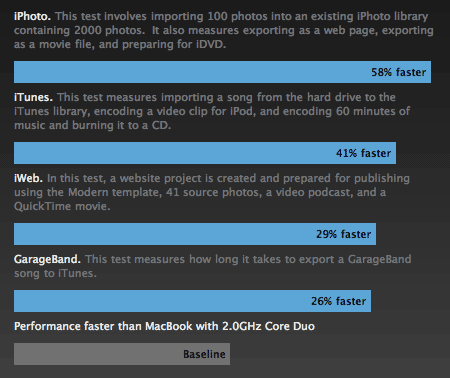
Deceptive Macbook Chart

At first glance, it was obvious that something wasn’t quite right. The percentages listed inside the blue bars don’t even remotely correspond to the visual length of those bars relative to the baseline bar at the bottom. It isn’t even close.

I took a screenshot and did some measuring in Photoshop with the ruler tool. The baseline bar is 216 pixels wide. The bars above it are 357, 362, 382, and 417 pixels wide, respectively. That would yield rounded percentages of 65%, 68%, 77%, and 93%.

I assume the numbers are correct and Apple is just being deceptive to make the performance gains look more impressive. In any case, it’s definitely not cool.